Knowledge Base Article
How to Read a Campaign's Analytics and Metrics
Analytics & Metrics is the campaign's scoreboard. It gathers what the campaign raised and spent, the leads and email it produced, and the marketing results you track by hand, on seven screens listed down the left.
Open Analytics & Metrics
Open the campaign and click Analytics & Metrics in the workspace menu. Pick a screen from the list on the left. Refresh reloads the numbers, and Export CSV downloads them for admins and for users allowed to export lists.
Fundraising Results
The money side of the campaign:
- Campaign Budget and Projected Revenue come from Budget & Financials: the target budget, and the total of your projected income.
- Gross Revenue is what the campaign has actually brought in, and Total Expenses is every expense coded to it.
- Net Revenue is gross revenue less expenses.
- Fundraising Progress is gross revenue as a share of projected revenue.
Gross Revenue is a saved figure rather than a live one. It is brought up to date whenever someone who can edit the campaign opens Budget & Financials and its Actual Income screen, so open that screen first if the figure looks behind.
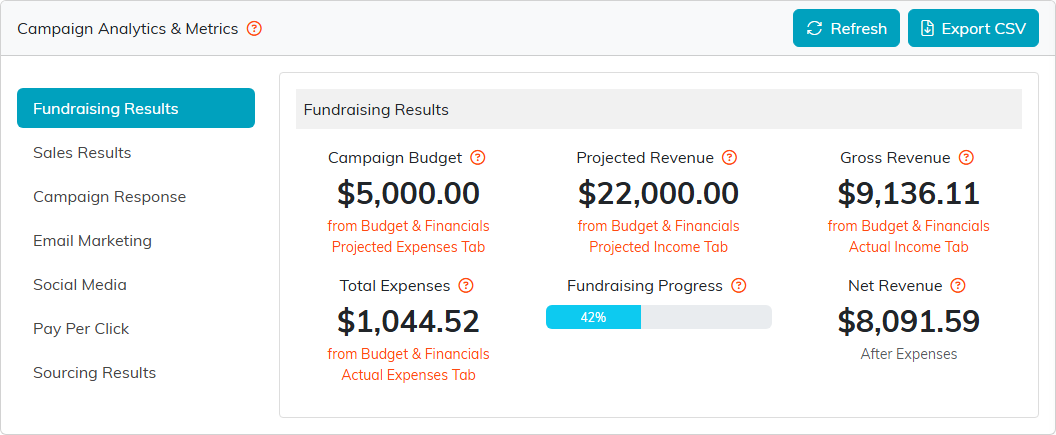
The orange notes under each figure tell you which screen it comes from.
Sales Results
Leads Acquired counts the leads connected to this campaign, and Leads Converted counts those that converted through it. Total Spend is the campaign's expenses, and Cost Per Lead and Cost Per Conversion divide it by those two counts.
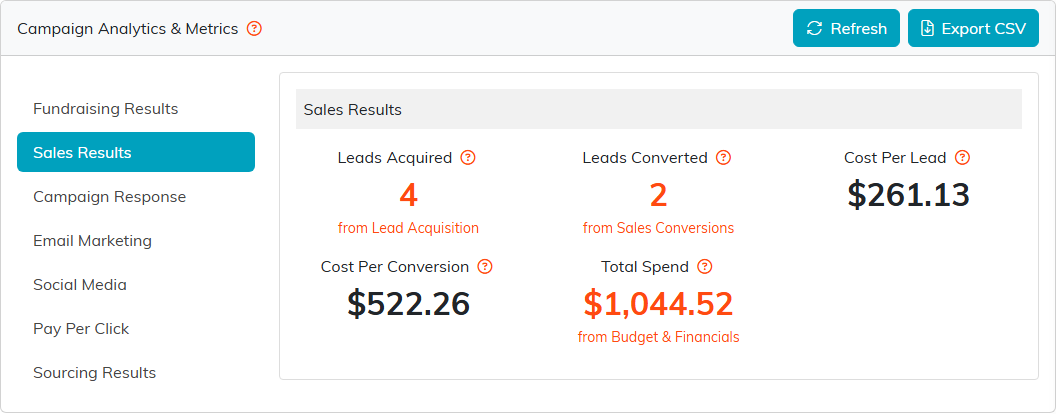
Spend divided by the leads the campaign produced.
Campaign Response
Three numbers you type in yourself: Total Targeted (how many people you set out to reach), Response Projected (how many replies you expected) and Total Response (how many you got). Click Save Changes.
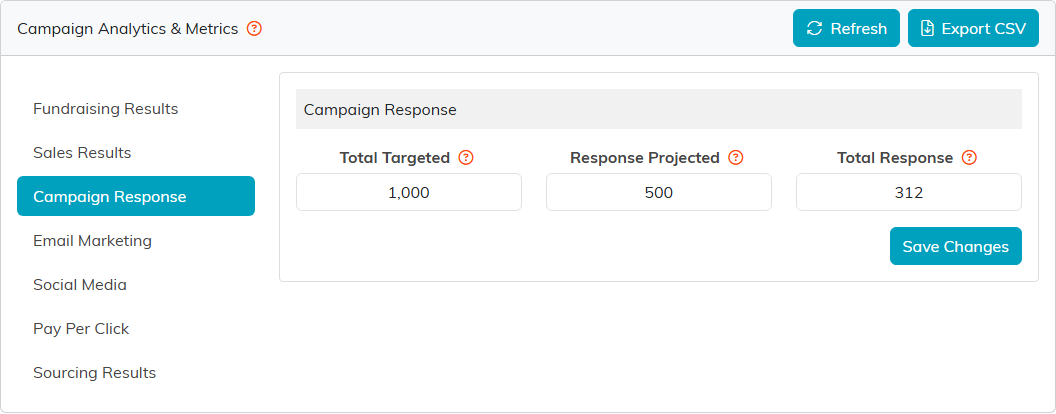
These three are yours to keep up to date.
Email Marketing
The top row holds three numbers you track by hand: Total Link Clicks, Total Positive Responses and Total Negative Responses. Click Save after changing them.
Below them, Argenta adds up every email batch this campaign sent: emails sent, opened, not opened, bounced, unsubscribes and spam reports. The Per-Batch Breakdown lists each batch on its own line, so you can see which subject line did best. Click a template's name to open that batch in a new tab.
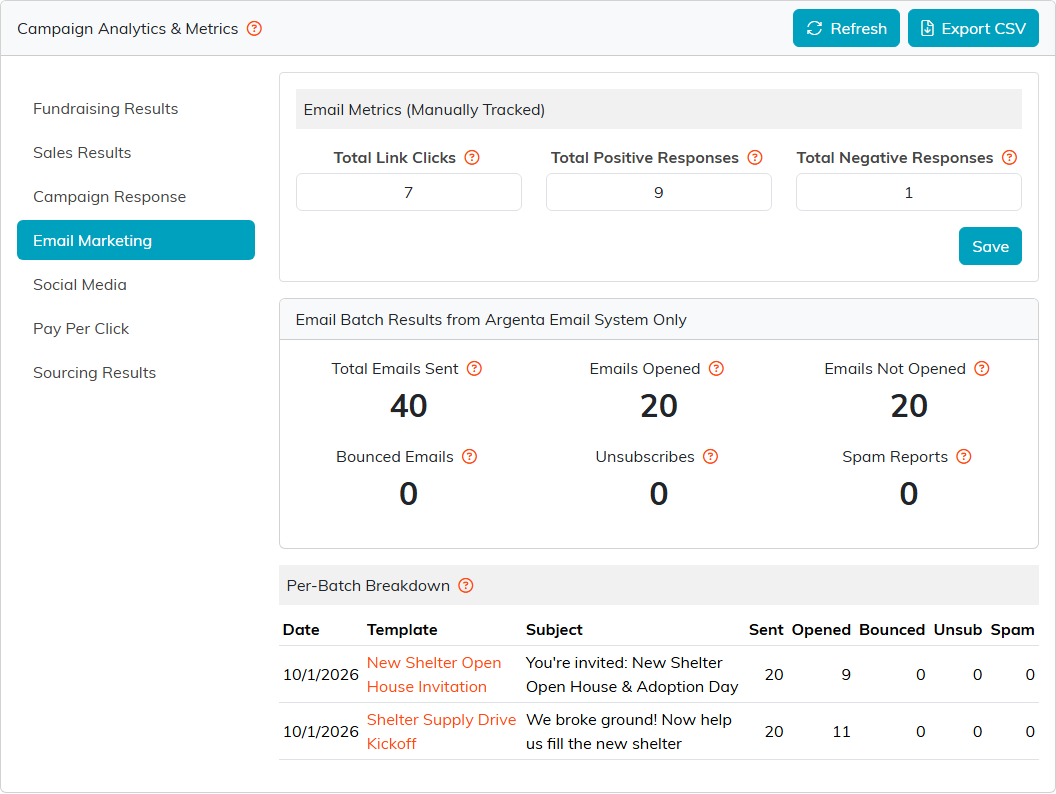
The batch figures fill in by themselves from the campaign's email batches.
Social Media, Pay Per Click and Sourcing Results
These three screens add up result sets you enter by hand from your own reports. Nothing is pulled in from the platforms themselves.
- Social Media: clicks, likes, shares and follows.
- Pay Per Click: impressions, clicks, your bid and the cost per click.
- Sourcing Results: connections sent and accepted, messages sent and message responses.
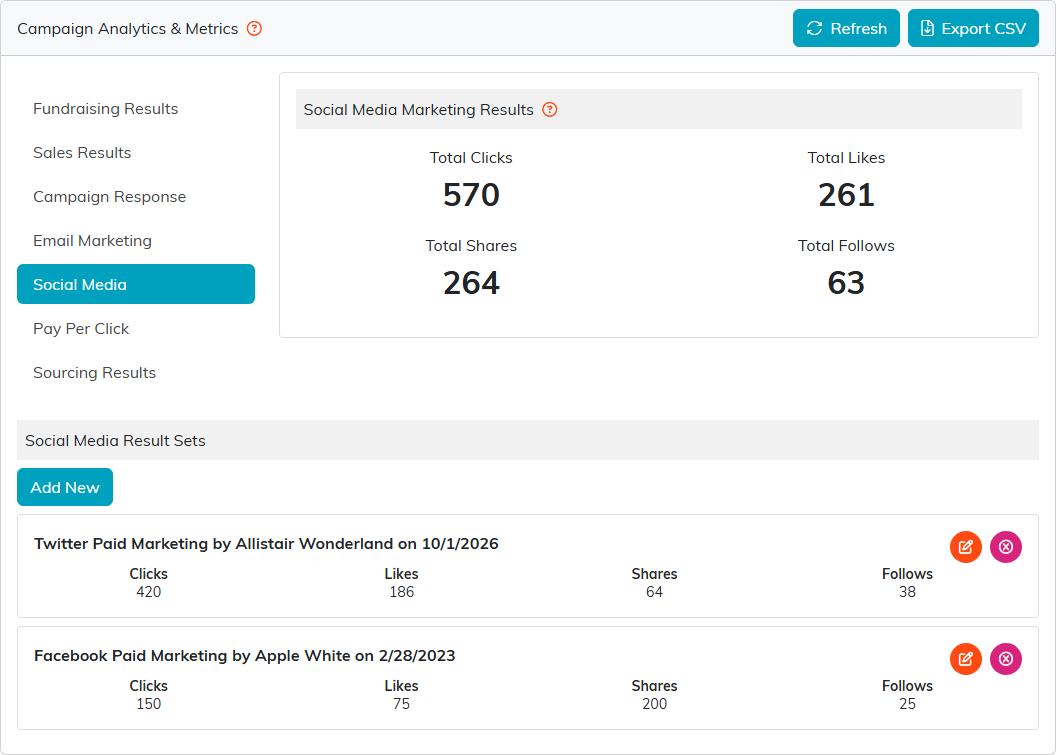
The totals at the top add up the result sets listed below them.
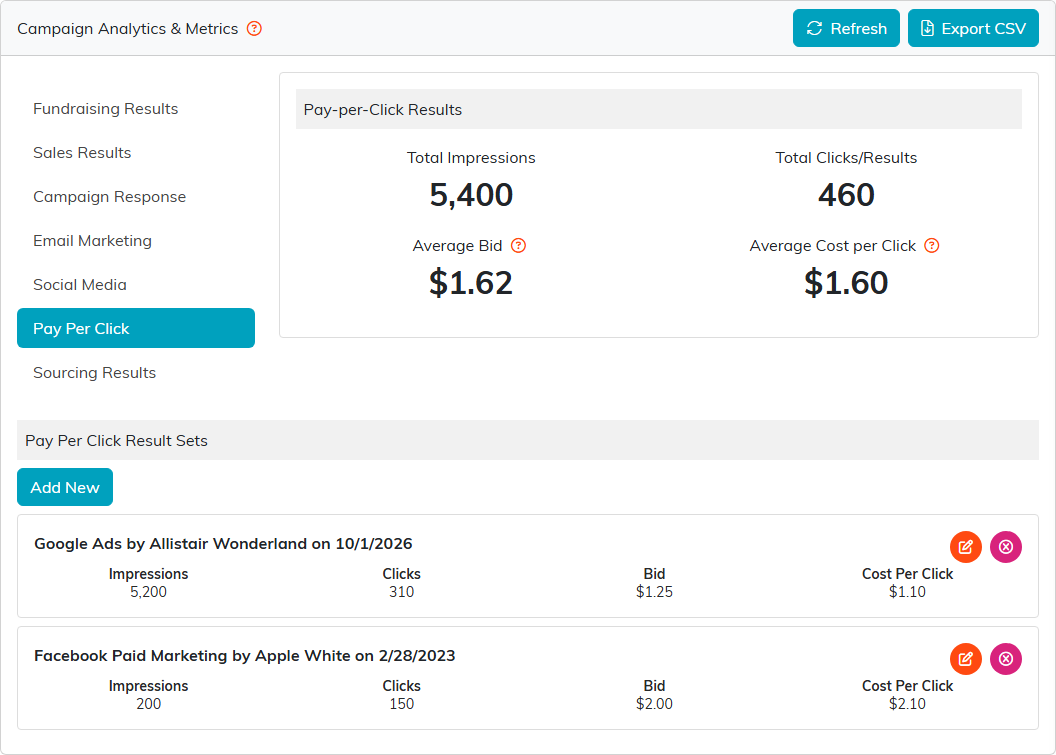
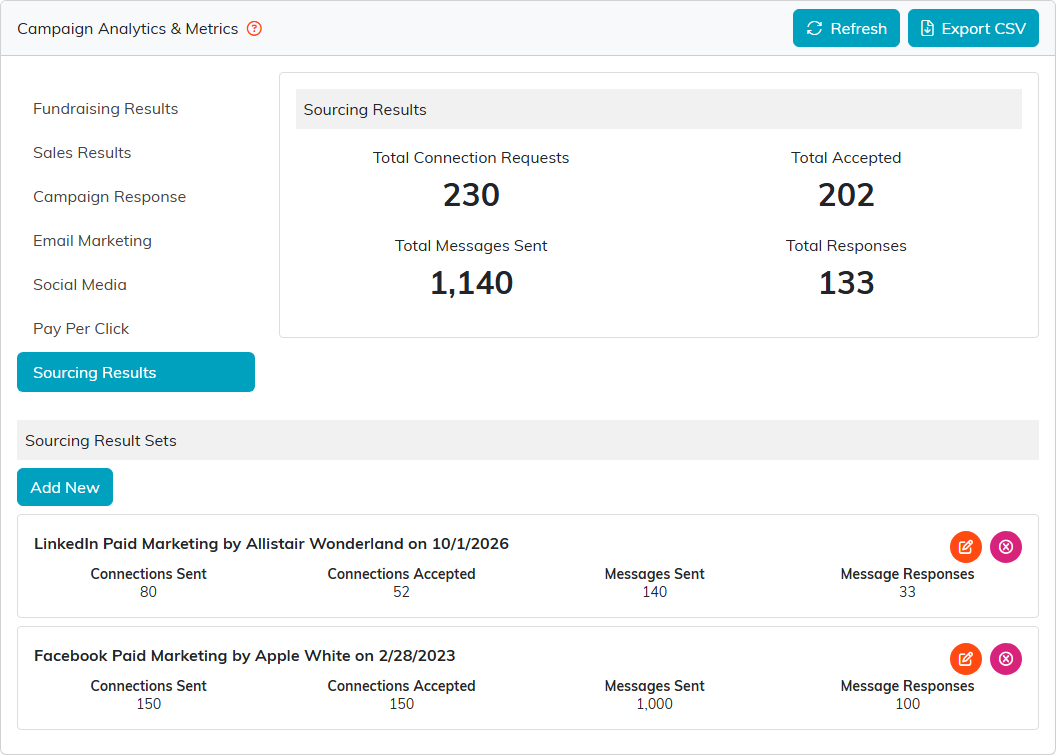
To add a result set, click Add New under the totals, pick the Source, enter the numbers, and click Add This Result Set. Add one set per source and per reporting period. The edit and delete icons on each set change or remove it, and the totals follow.
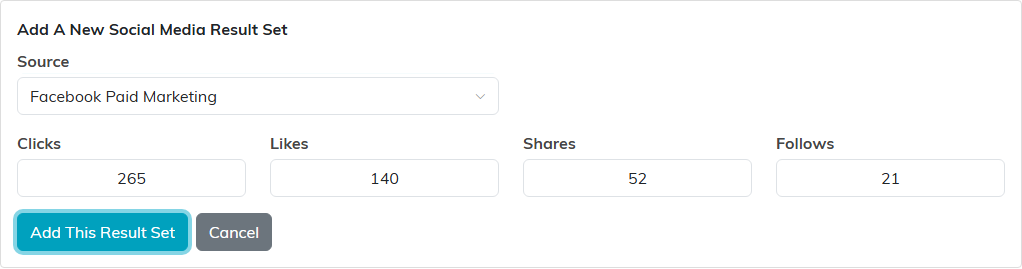
One result set per source and reporting period.
For a tour of every page in the Campaign Workspace, see Overview, Working with Campaigns.